Looker Studio for marketers in 2026: dashboards from Y.Metrica, Y.Direct and VK Ads for free
Looker Studio combines Ya.Metrika, Ya.Direct and VK Ads in one free dashboard. Analysis: how to connect Russian data sources, configure Blended Data for end-to-end CPL across channels, automatically send reports to clients on a schedule and not overload the dashboard with unnecessary widgets.
Looker Studio (formerly Google Data Studio) is the most convenient free tool for marketing dashboards. But most marketers in the Russian Federation either do not know about it or are stuck on the built-in reports of Ya. Metrica. I realized this when the client on the third project asked: “Is it possible to see all this in one window?”
I use Looker Studio on client projects. Each one has a dashboard that combines data from Ya.Metrica, budgets from Yandex Direct and VK Ads (via Google Sheets), and CRM conversions. Set up once, then it works on its own. The client receives a PDF report on schedule without my participation.
A good dashboard is not about pretty graphs. This is the answer to one question: “What happens to the money?” Everything else is decoration.
1. Why Looker Studio and not Excel or embedded analytics
The built-in reports of Ya.Metrica show only the data of one counter. Yandex Direct - only your analytics. VK Ads - yours. To see CPL by channel, you need to open three windows and add them in your head.
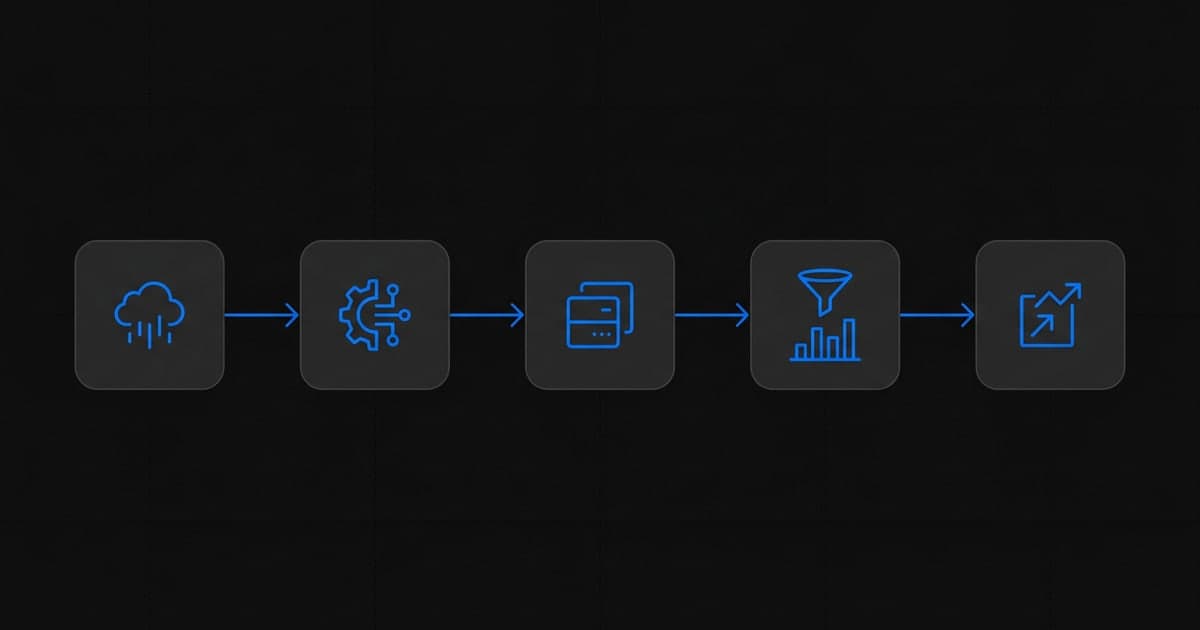
Looker Studio brings everything together on one screen. Data sources: Yandex Metrica, Google Sheets (where we upload data from Yandex Direct and VK Ads), CRM via Sheets or directly. The result is a dashboard with CPL by channel, ROAS, conversion dynamics - everything in one place, automatically updated.
Another plus: sharing via a link without access to the Metrica counter. The client sees the dashboard, but does not have access to the raw data. This is convenient when the client does not have the technical literacy to understand Metrica on their own.
2. Data sources for the Russian marketer
| Data source | Connector | Cost | Difficulty setting up | Data |
|---|---|---|---|---|
| Yandex Metrica | Community Connector (free) | 0 ₽ | Low | Sessions, goals, UTM, behavior |
| Yandex Direct | Google Sheets (manual upload or API) | 0 ₽ (manual) / from 500 ₽/month (API) | Average | Costs, clicks, CPC, CPL |
| VK Ads | Google Sheets / Supermetrics | 0 ₽ / from $29/month | Average | Costs, reach, CTR, CPL |
| Google Ads | Native (built-in) | 0 ₽ | Low | Full campaign statistics |
| amoCRM / Bitrix24 | Google Sheets (webhook) / Albato | 0-2,000 ₽/month | High | Transactions, revenue, LTV |
Supermetrics is not free, but is a game changer for an agency with multiple clients. Native support for Yandex Direct and VK Ads without Google Sheets as a buffer. Price - from $29/month for one connector. For three clients with budgets starting from 200K ₽/month, this pays off in one working day.
3. Structure of a good dashboard
I build client dashboards according to one principle: the first screen is three numbers, the second is a table by channels, the third is dynamics. More than three screens - the client stops reading.
First screen. Three Scorecard widgets: total budget for the period, number of conversions, CPL (final). Below is a pie chart of budget distribution by channel. Everything - for the selected period with Date Range control.
Second screen. Table: channel, budget, clicks, conversions, CPL, share of the total budget. This is the main screen for the planning meeting. It shows which channel gives CPL below the target, and which above.
Third screen. Line chart of CPL by week for 3 months. It helps to see seasonality and anomalies: “in the third week of November, CPL doubled - then Yandex Direct won the New Year’s bets.” Comparison with plan - dotted line.
4. Blended Data: combining sources
Looker Studio's main superpower is Blended Data. This is a JOIN between two sources on a common field. In relation to marketing: Source 1 - Yandex Metrica (conversions from UTM sources), Source 2 - Google Sheets with budgets from Yandex Direct and VK Ads from the same UTM sources. Join on the “source” field - and on the output CPL (budget / conversion) for each channel on one chart.
This is end-to-end analytics without a paid BI tool. Not ideal - because Sheets are updated manually or on a schedule, not in real time. But for a weekly report to the client it is enough. Read more about end-to-end attribution in 2026 - in a separate analysis.
Important: before Blending Data, make sure that the source names in both tables match exactly. “yandex_direct” in Metrica and “Yandex Direct” in Sheets are two different values, JOIN will not work. Everything is done through standardized UTMs - that’s why UTM schema there should be one for the whole team.
5. Automatic reports to clients
The Schedule Email Delivery feature in Looker Studio is the most invisible and most useful for an agency. Set up in 2 minutes: File → Mailing schedule → add client email → select frequency (weekly on Mondays, for example) → done.
The client receives PDF from the dashboard according to schedule. I no longer do manual reports. Out of three hours a week, 15 minutes are left for reporting - just to comment on anomalies in the letter.
One caveat: if the data source stops updating (Sheets did not receive new data, the Metrics connector “fell”), the PDF will leave with outdated data - and the client is not warned. Therefore, I add a widget to the dashboard “Data updated: [date]” - if the date is old, the client will write it himself.
6. Errors when setting up Looker Studio
1. Too many widgets on one screen. Six graphs, four tables, two Scorecards - the client looks at it for 10 seconds and closes. The first screen is a maximum of three key numbers and one graph.
2. There is no filter by date. A static dashboard without Date Range control is useless - data for a fixed period becomes outdated. Always add a Date Range and set the default to “last 30 days”.
3. Mix metrics from different funnel levels. On the same screen, CPL (top of the funnel) and LTV (bottom of the funnel) create confusion. Split across screens or tabs.
4. Failure to check the connector data before sharing to the client. Ya.Metrica connectors sometimes provide data with a delay or lose sessions at the turn of the day. I always check the key numbers in the dashboard with the numbers in Metrica directly before sending a link to the client.
5. No context for the numbers. “CPL 2,400 ₽” - is it good or bad? The client does not know if the dashboard does not have a planned line or comparison with the previous period. Always add “plan” and “past period” to Scorecard widgets. About media plan and plan/fact analysis - separate article.
7. Summary
Looker Studio solves three tasks per day: combine data from Y.Metrica and advertising accounts in one place, create a clear report for the client without access to the counter, automate the weekly newsletter. All this is free.
Three steps at the start: connect Ya.Metrika via Community Connector, add Google Sheets with advertising campaign budgets, configure Blended Data using utm_source. This takes 4-6 hours when you first get acquainted with the tool.
Related materials: KPI dashboard template, ROAS/ROMI calculator, Setting goals in Ya.Metrika, UTM scheme for an agency.
If you need help setting up a dashboard for specific sources, write to Telegram or through form. Starting consultation - 0 ₽.